Cardiogram Heart IQ Quick Start Guide
Welcome to Cardiogram! This guide will help you get started in minutes, whether you're using an Apple Watch, Fitbit, Garmin, or Wear OS device.
✅ Step 1: Set Up Cardiogram
Download the Cardiogram app on your iPhone or Android device
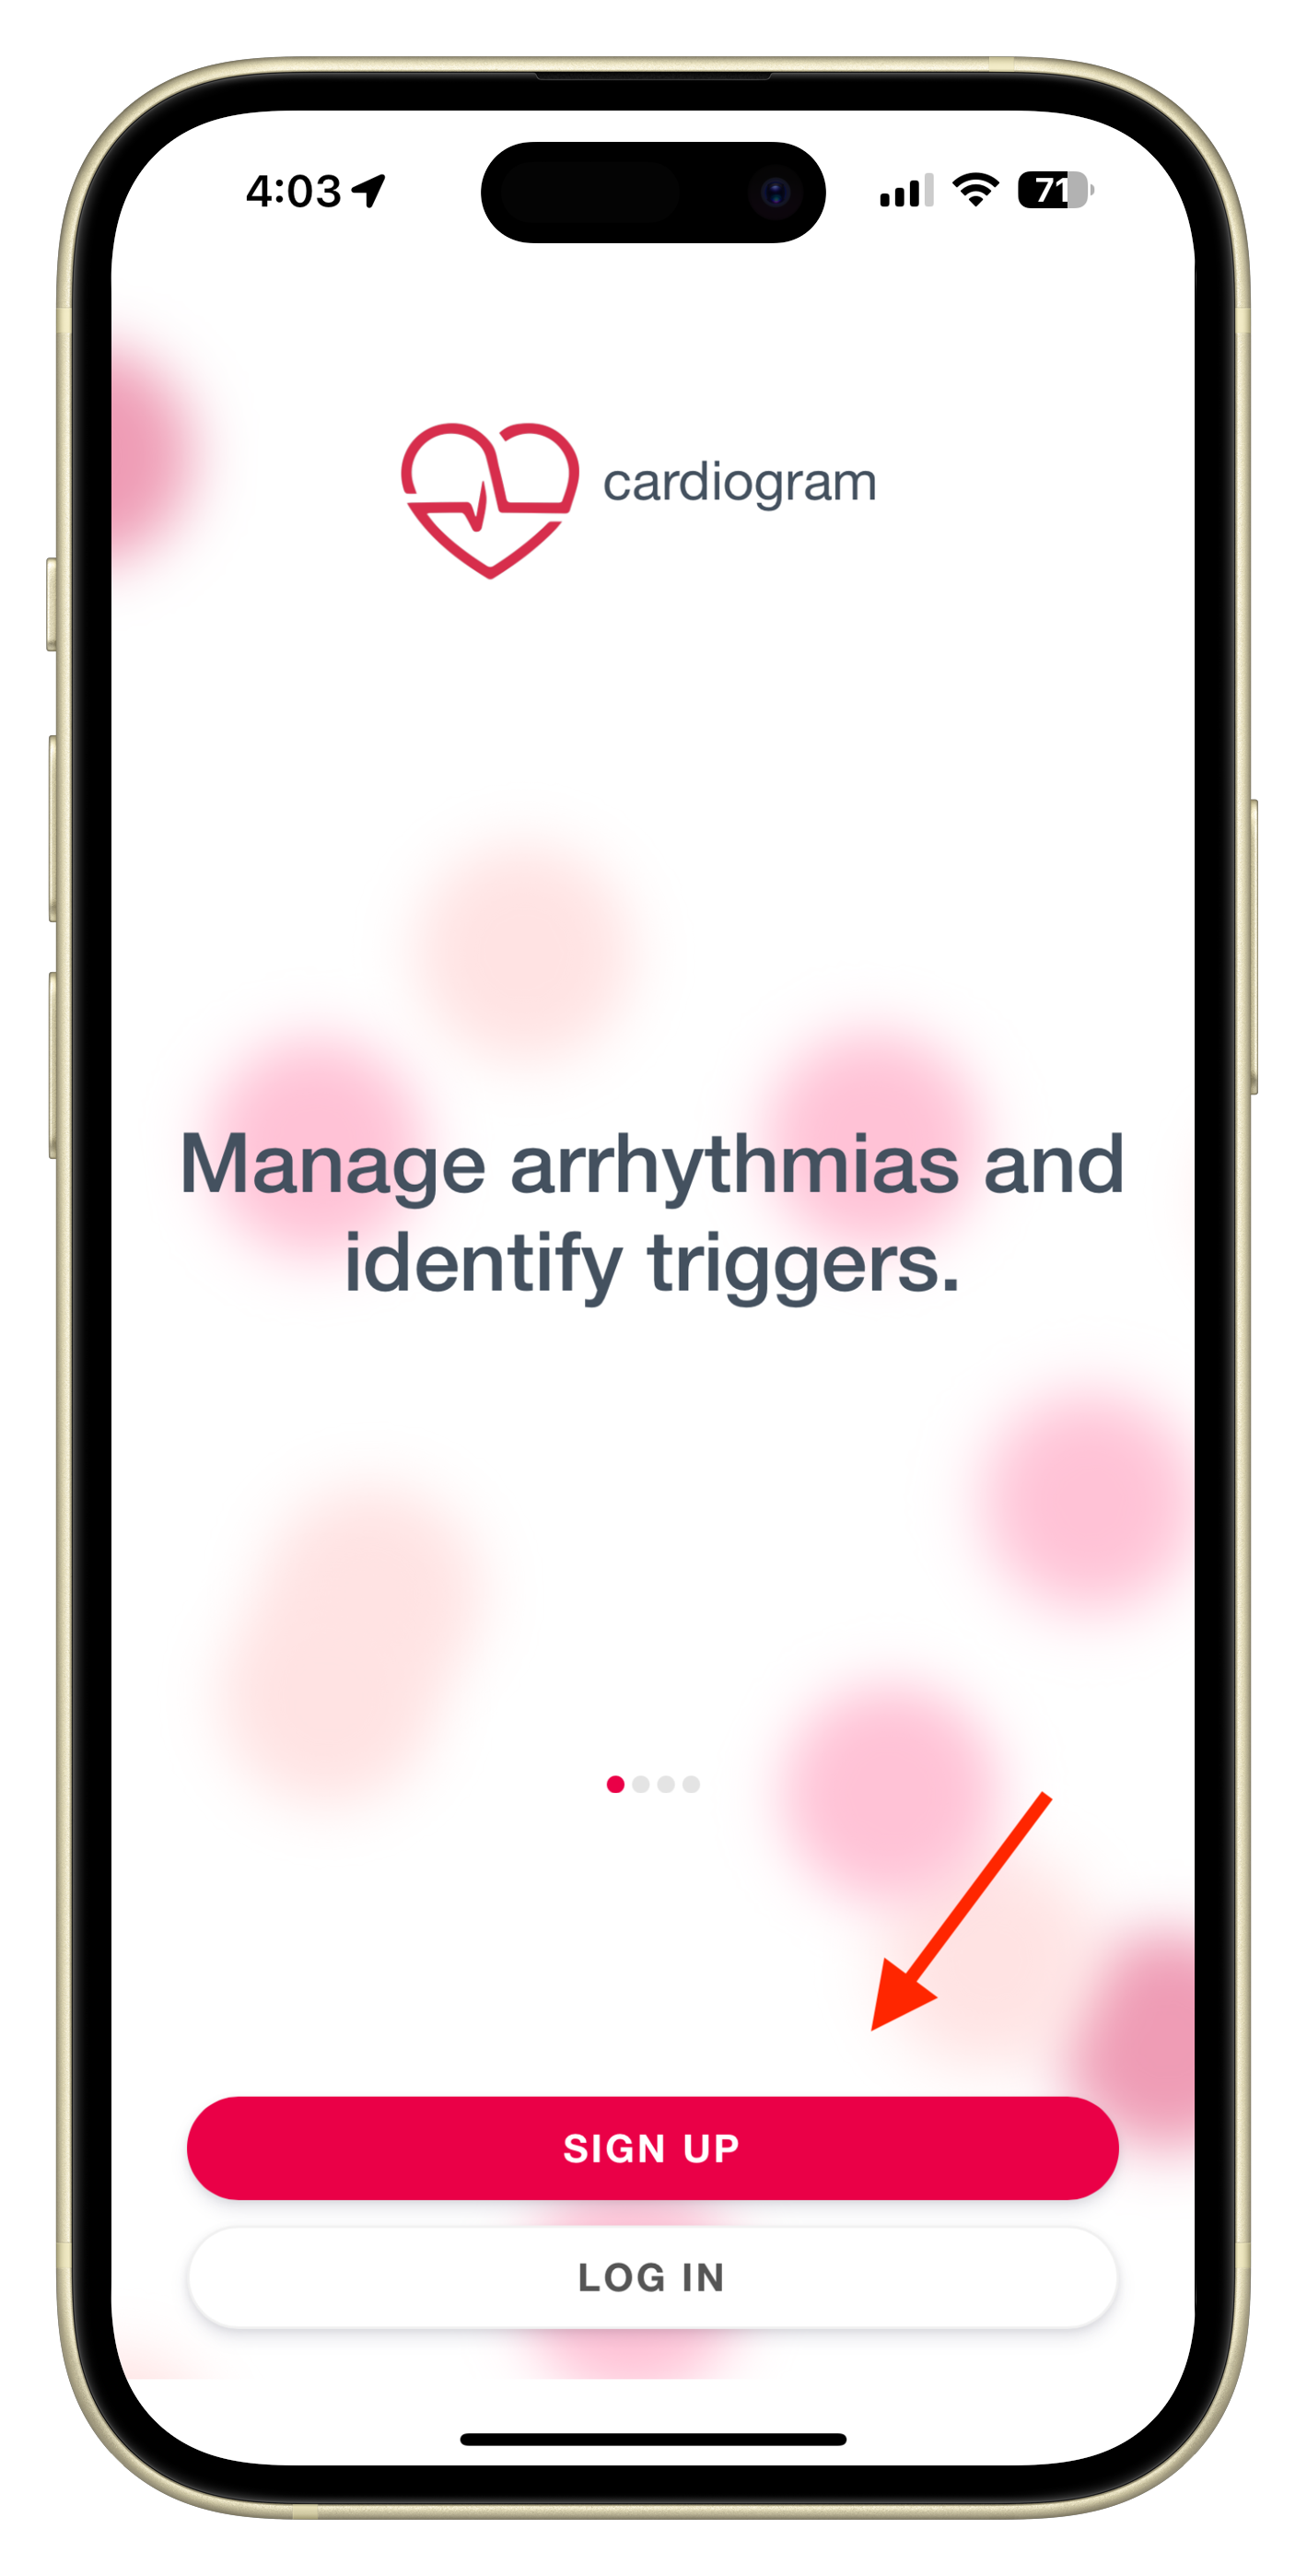
Create a profile or sign in using your email, Apple ID, Google, or Facebook

Connect your wearable
- Cardiogram supports:
- Apple Watch (via Apple Health)
- Fitbit and Pixel Watch
- Garmin (via Garmin Connect)
- Wear OS (including Samsung Galaxy Watch 4 or newer)
- Cardiogram supports:


📌 Not seeing data yet? Troubleshoot here 👉 I Don’t See My Data in Cardiogram — What Should I Do?
📊 Step 2: View Your Heart Rate Timeline
- Open the Timeline tab to see your heart rate throughout the day
- Use pinch to zoom to view 1-minute segments
- Tap any data point to explore more details

Add tags or symptoms to journal how you're feeling

📤 Step 3: Keep Cardiogram in Sync
- Cardiogram pulls data from your watch's native app (Apple Health, Fitbit, Garmin Connect, etc.)
- Make sure your watch is syncing with your phone regularly
- For best results, open Cardiogram at least once a week to keep your profile up to date
⭐️ Unlock Premium Features
Want deeper health insights? Premium unlocks additional tools:
🔍 Report Card (Heart IQ)
AI-powered health risk scores for:
- Hypertension
- Sleep Apnea
- (More coming soon!)

🔔 Heart Rate Alerts
Get notified when your heart rate goes above or below your custom thresholds

👩🏫 Share With Doctor
Generate PDF and CSV reports to share with your healthcare provider

👥 Family Mode
Let someone you trust view your heart data from their own Cardiogram app

Upgrade to Premium in the app anytime from ☰ Menu > Upgrade to Heart IQ or Migraine IQ
🔧 Extra Tools You Can Try
These work with both free and premium plans:
- Add the Cardiogram widget to your iPhone Home Screen
- Turn on Continuous Mode during workouts for high-frequency tracking
- Log Blood Pressure manually under the new Blood Pressure Log
- Edit tags and symptoms to track patterns over time
🚘 Need Help?
We’re here for you.
📩 Email: [email protected]
🔍 Help Center: help.cardiogram.com